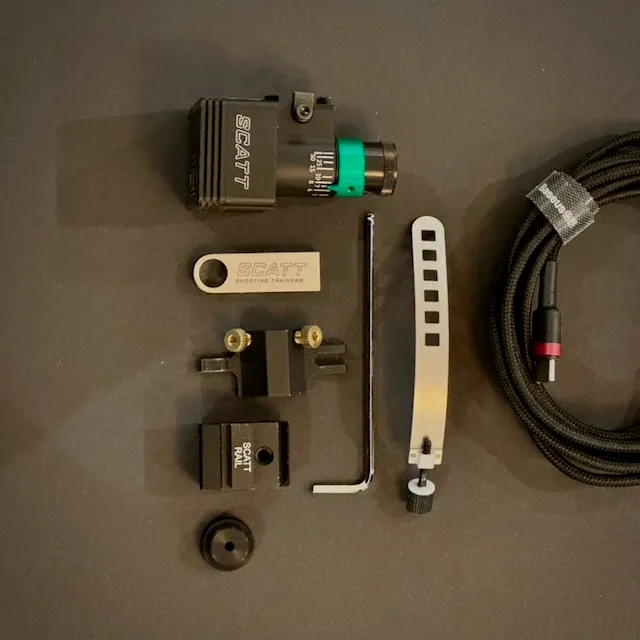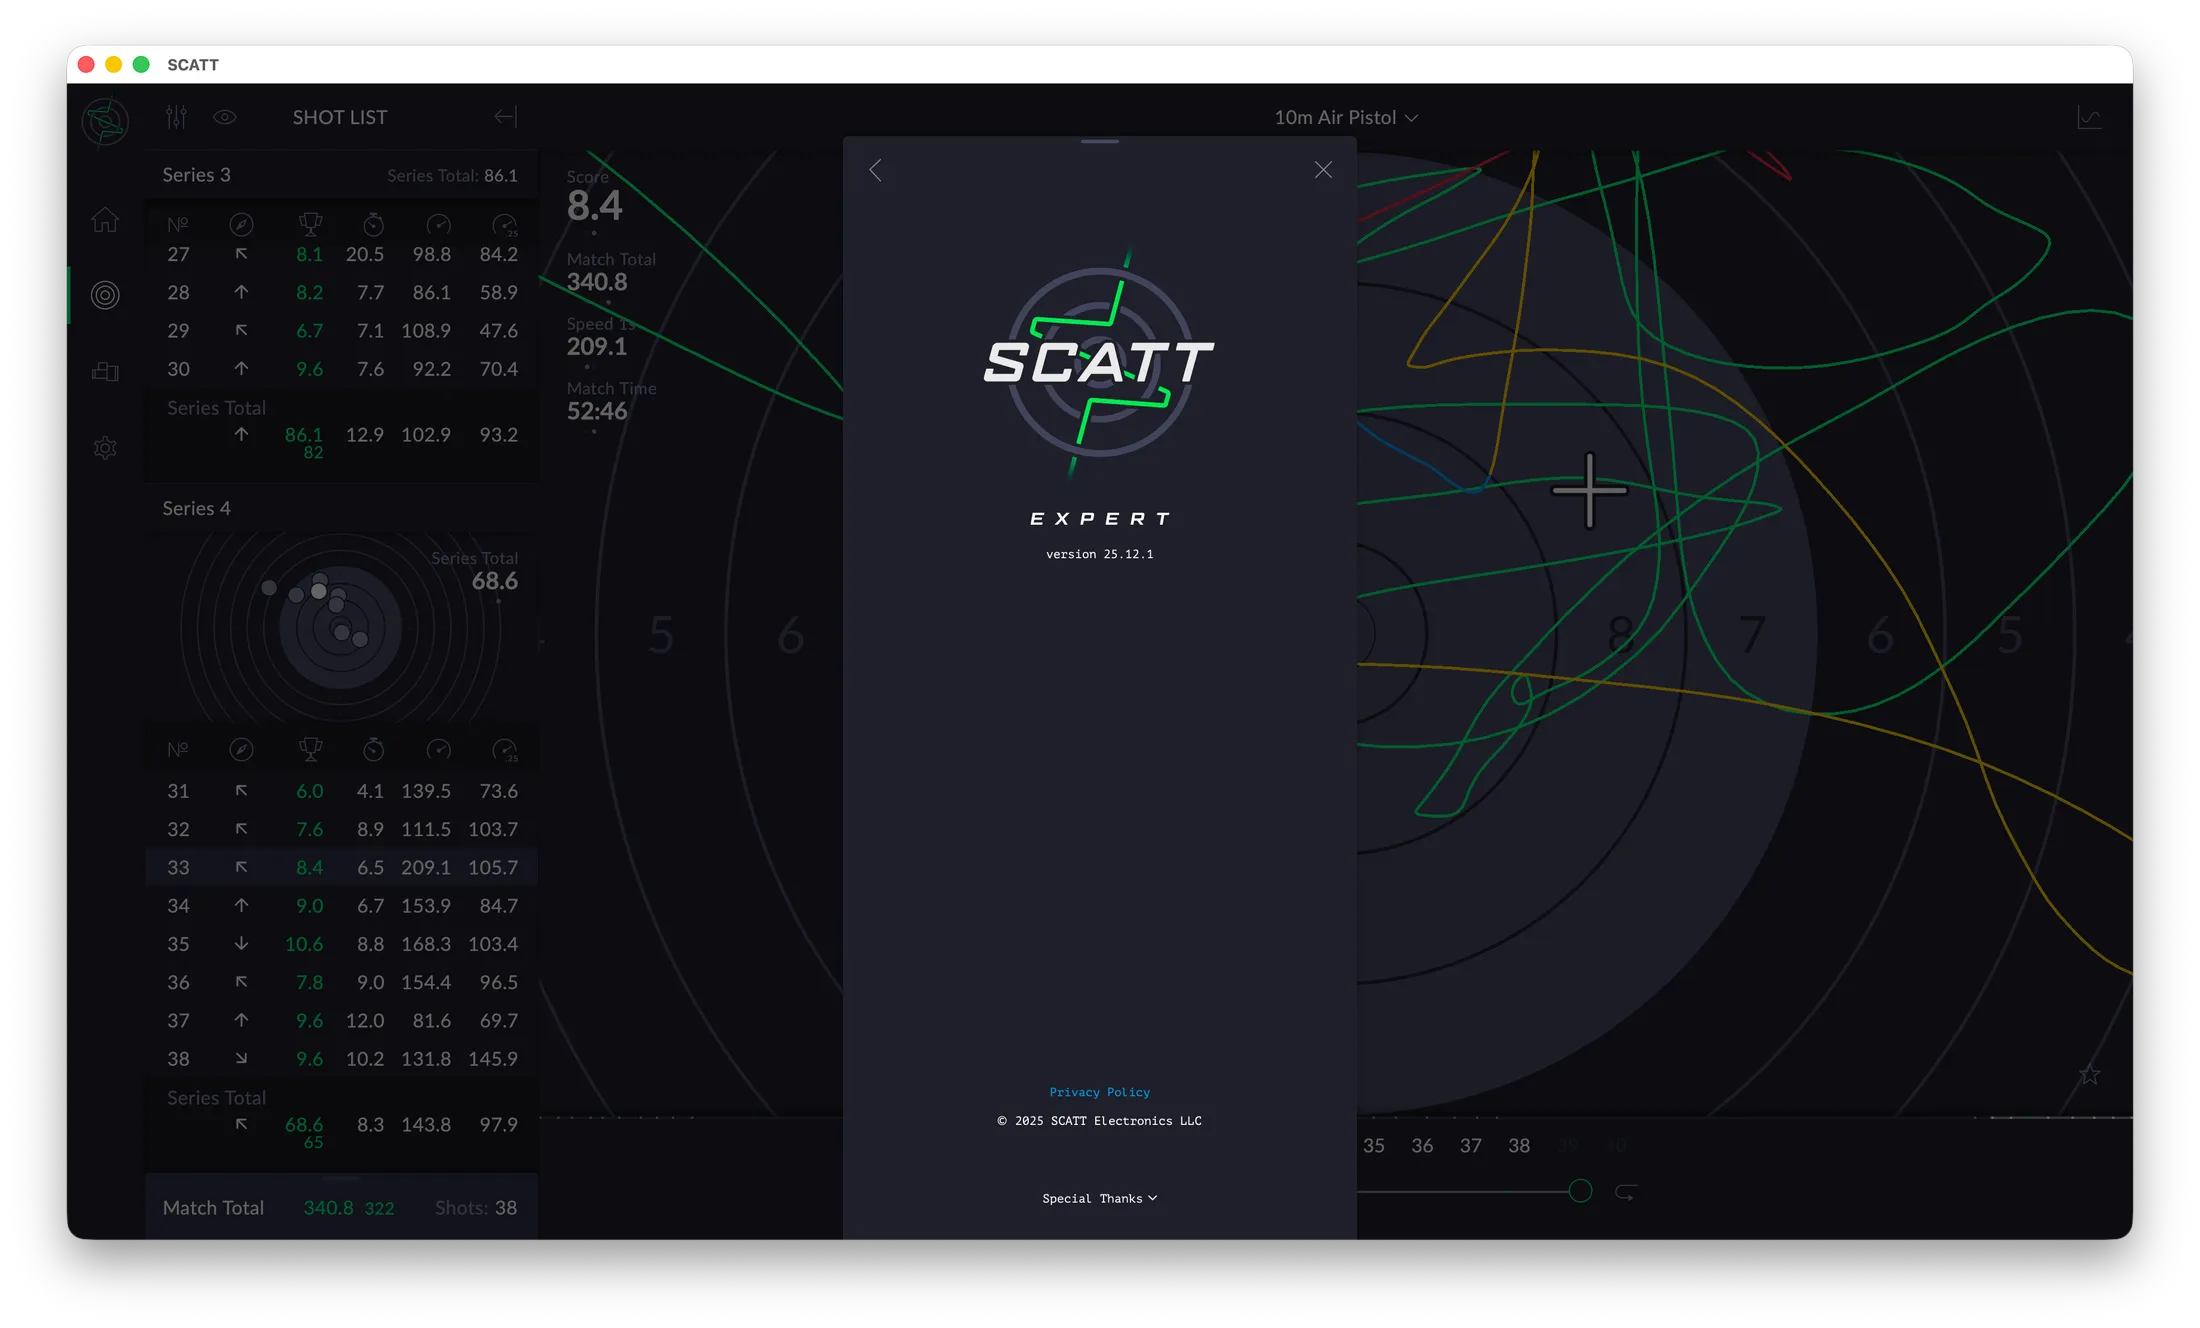
Scatt Expert 25.12.1 for the MX-W2 was introduced at SHOT Show 2026, bringing a range of refinements focused on usability, clarity, and deeper performance analysis. The software is currently available for Windows and macOS.
The user interface has been significantly refined compared to previous versions. Layout, scaling, and responsiveness have been improved to better support different screen sizes and resolutions, and the design language is now aligned with the mobile versions of Scatt Expert. This makes switching between desktop and mobile platforms more seamless.
Both dark and light display modes are supported.
The main window is organized into three primary columns:
- Shot List
- Target
- Analysis
Each column can be customized to display different data sets, allowing shooters and coaches to tailor the workspace to their specific training or analysis needs.
Before You Analyze: Required Calibration & Prerequisites
Correct interpretation of SCATT columns is only possible if the system is properly calibrated and used consistently. Without this, values such as S1, S2, DA, Hold, and Aiming Time become misleading or meaningless.
Calibration (mandatory every session)
Recalibrate whenever any of the following change:
- Lighting conditions
- Target distance or type
- Sensor mounting position
- Firearm or grip setup
Key requirements for pistol shooters
- Even, reflection-free target lighting
- Stable signal level before accepting calibration
- No unnecessary adjustment of piezo sensitivity
Incorrect calibration typically inflates speed values and corrupts DA.
Consistency requirements
- Fixed sensor mounting position
- Fixed analysis time window (1.0 s and 0.25 s recommended)
- Compare only sessions shot under identical conditions
SCATT measures barrel movement only. It evaluates process quality, not competition outcome.
Common SCATT Mistakes (and How to Avoid Them)
- Analyzing data without proper calibration
- Changing sensor position between sessions
- Comparing shooters instead of trends
- Using score as the primary evaluation metric
- Over-interpreting single shots
- Chasing low speed values deliberately
- Misreading S2 instead of its relationship to S1
- Ignoring DA when hold metrics look good
- Mixing training goals in one analysis
- Treating SCATT as a replacement for coaching judgment
SCATT amplifies truth — it does not create it.
Shot list
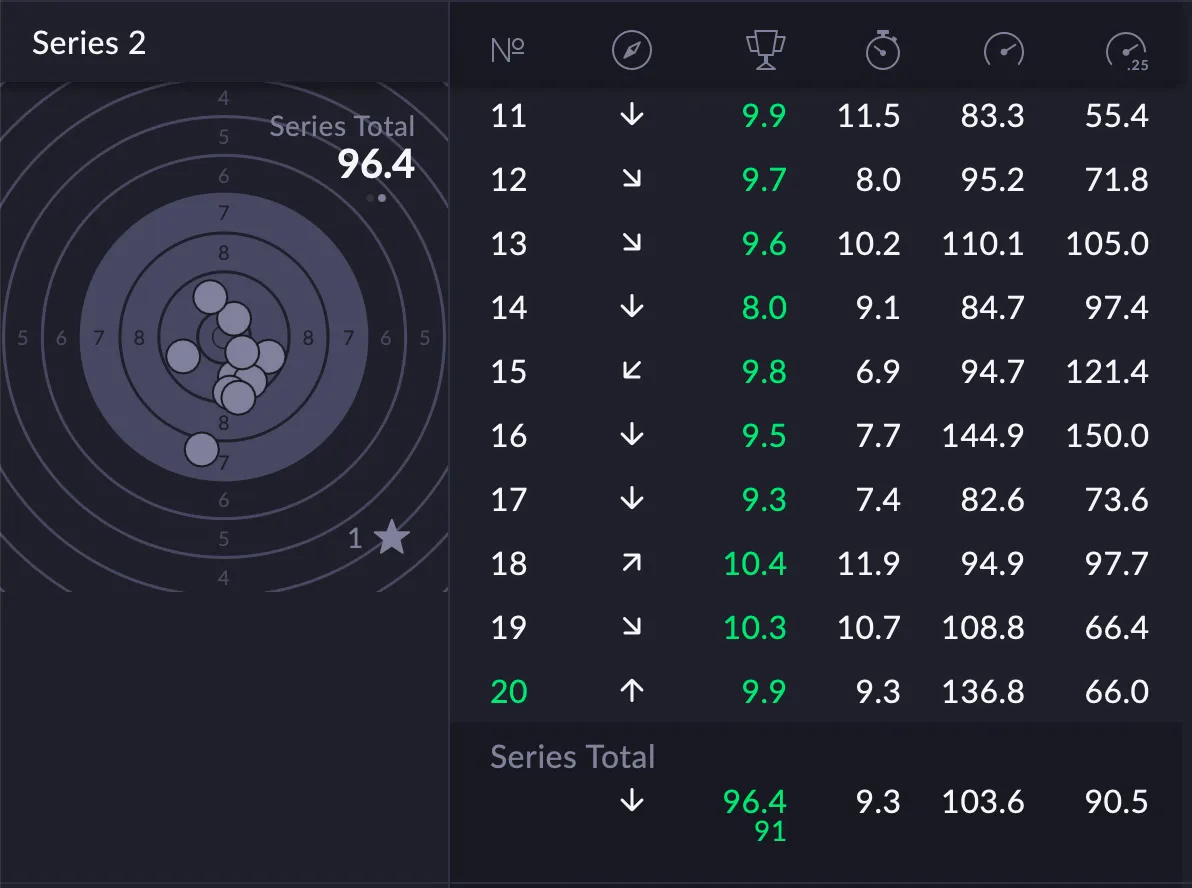
The interface is designed to evaluate and break down a shooter’s performance during a series of shots.
On the left side, a virtual target displays the shot group for a specific series. Each shot is plotted on the target face, allowing the shooter to visually assess grouping, consistency, and point of impact. A total score for the series is shown alongside the target.
On the right side, a detailed table lists individual shots from the series. For each shot, numerical data and indicators are provided, such as score (with decimals), directional movement before the shot, and various technical metrics related to hold stability, aim movement, and timing. These values help the shooter understand not just where the shot landed, but how it was executed.
At the bottom, summary statistics for the entire series are displayed. These aggregated values provide an overview of performance trends across all shots in the series.
Overall, this screen is used for technical performance analysis. It allows shooters and coaches to evaluate shot execution, movement patterns before trigger release, stability, and consistency, making it a tool for structured training and improvement rather than just score tracking.
By default these columns are shown
- Shot direction
- Score
- Aiming time
- Speed in 1 sec
- Speed in 0.25 sec
Settings
The shot list windows can be customized to the users preferences.
Overall there is
1. Show shots
Deleted shots (on/off)
Show or hide shots that were marked as deleted
2. Display settings
Display: Target and List, Target, List
3. Column Setup
Text in parentheses is the equivalent column code used in SCATT Expert 20.05.31.
Shot Index (#)
Shot number. Default: on · read-only
Practical interpretation (pistol)
- Used for sequence and fatigue analysis
- Deterioration later in the index often indicates grip or postural fatigue
Hit or Miss Status
Biathlon only Default: on · read-only
Practical interpretation (pistol)
- Not relevant for precision pistol
- Can be ignored
Shot Direction (D)
Relative to center
Shows directional offset relative to the target center.
Practical interpretation (pistol)
- Key for diagnosing systematic trigger and grip errors
- Typical patterns (RH shooter):
- Low-left → trigger jerk or grip collapse
- High-right → anticipation or thumb pressure
- Tight but offset groups indicate good technique, wrong zero
Score (R)
Default: on · read-only
Displayed as integer or decimal, depending on the event.
Practical interpretation (pistol)
- Analyze last, never first
- High score with poor hold metrics often masks technical weakness
- Low score with good metrics usually indicates timing errors
Aiming Time (T)
Time from aimpoint entering the target until shot release.
Practical interpretation (pistol)
- Critical routine indicator
- Typical ranges:
- < 3 s → rushed
- 4–7 s → optimal for most shooters
- > 8–9 s → fatigue, hesitation, or over-aiming
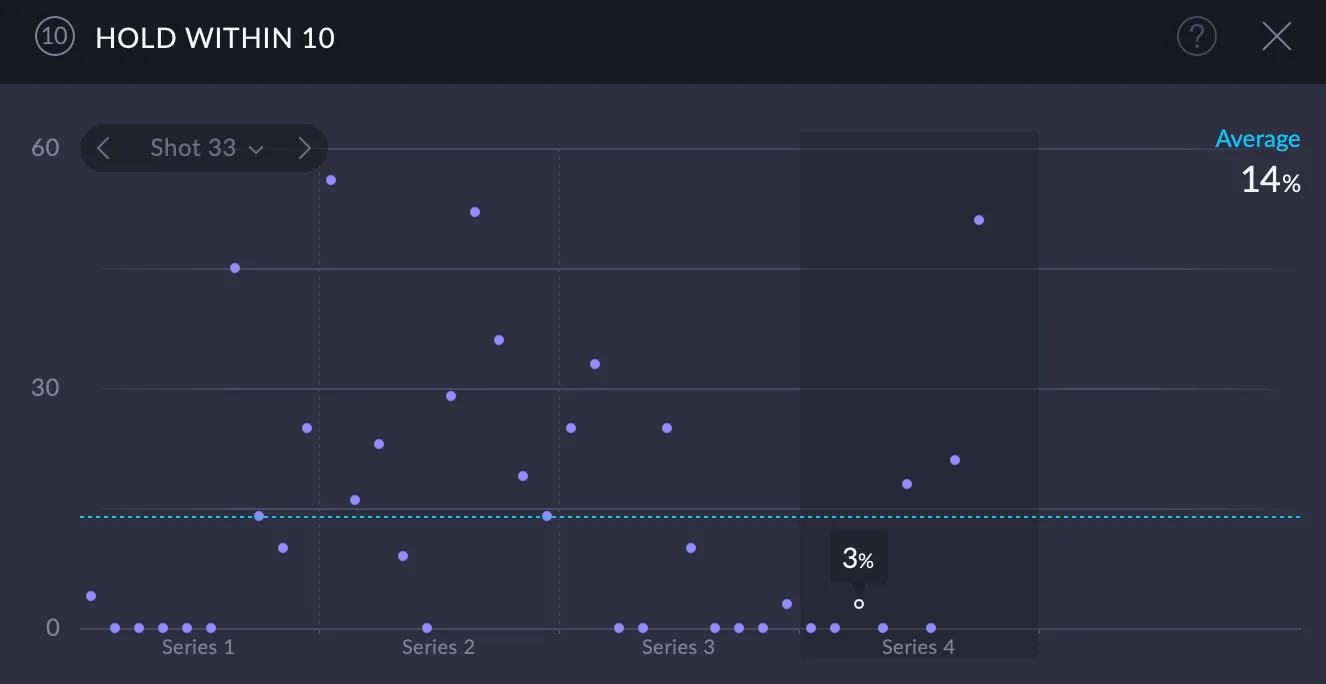
Hold within 10 (10.0)
Time aimpoint stayed within the 10-ring, referenced to target center (%).
Practical interpretation (pistol)
- Measures absolute stability
- Useful, but less diagnostic than relative metrics
- Low values with good scores often indicate “sniping”
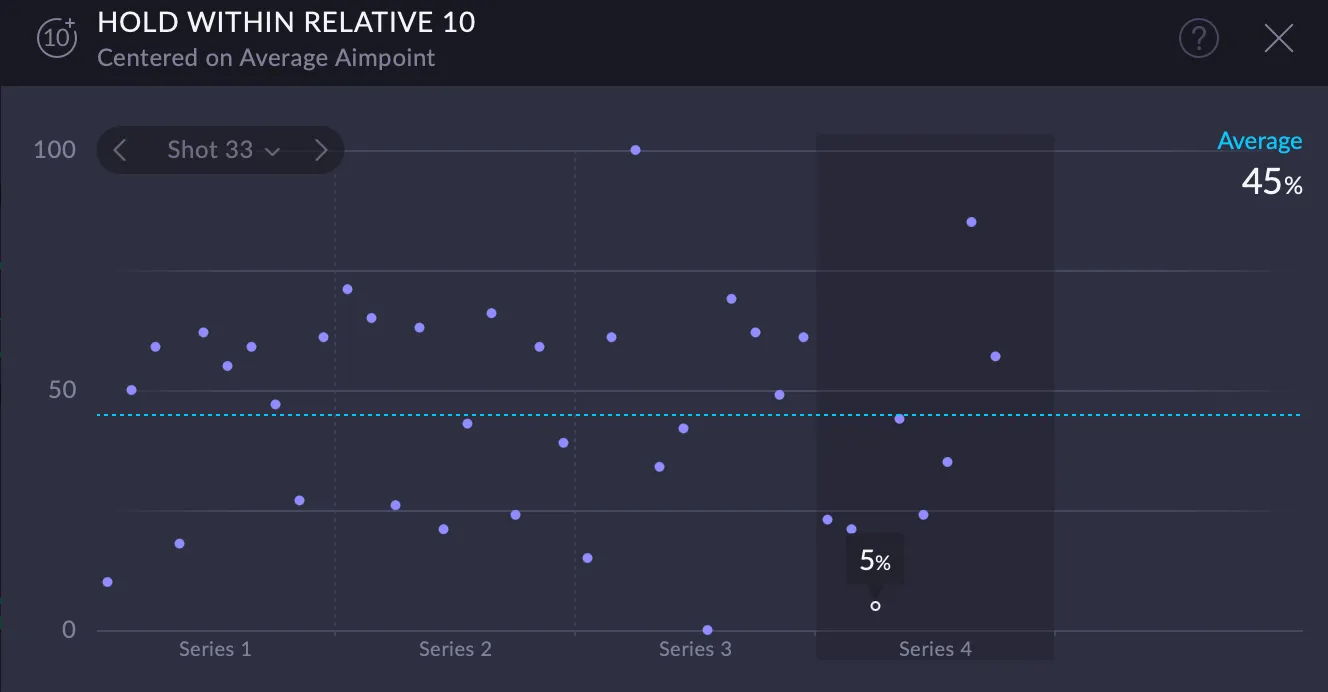
Hold within Relative 10 (10a0)
Centered on Average Aimpoint
Time aimpoint stayed within the 10-ring (%).
Practical interpretation (pistol)
- Separates stability from centering
- High relative / low absolute hold = stable shooter, wrong zero or NPA
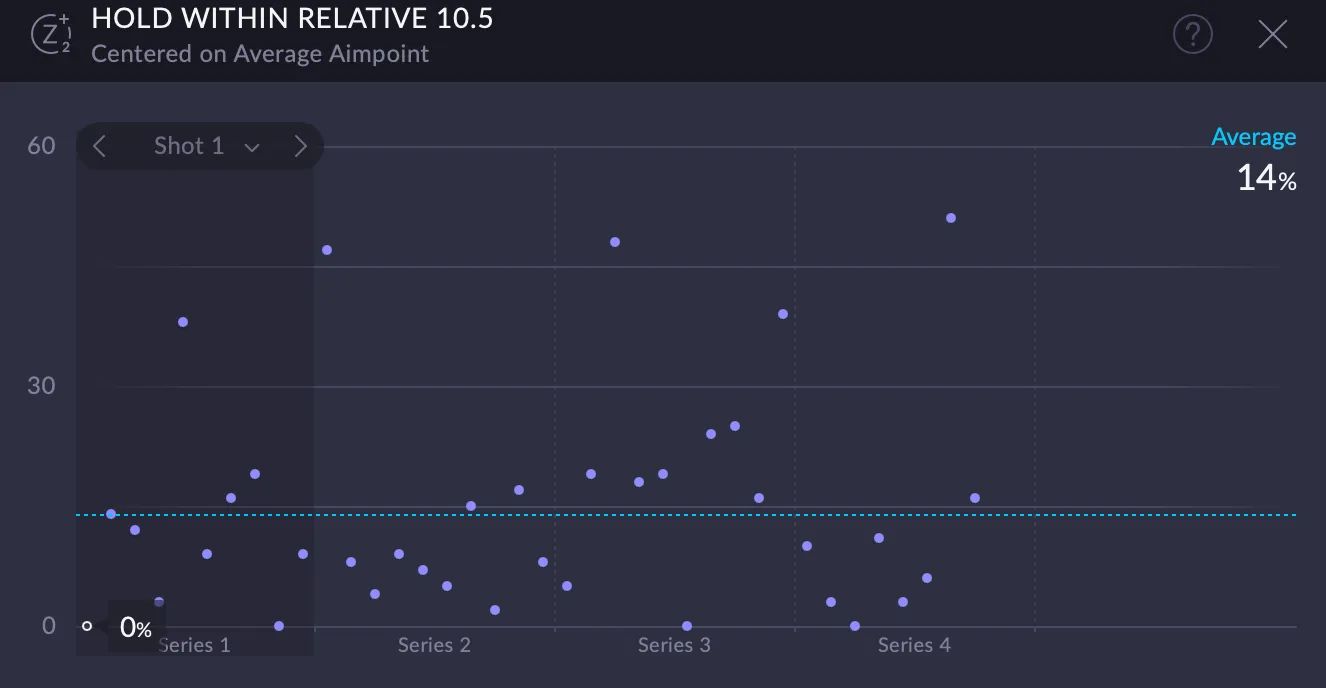
Hold within Z (1 and 2)
Time aimpoint stayed within a custom ring, referenced to target center (%). Z adjustable from 1.0 to 10.9.
Practical interpretation (pistol)
- Match Z to the shooter’s real hold ability
- High Hold within Z + low score = trigger problem

Hold within Relative Z (1 and 2)
Centered on Average Aimpoint
Time aimpoint stayed within a custom ring (%).
Practical interpretation (pistol)
- One of the best indicators of true stability
- Excellent for long-term progress tracking

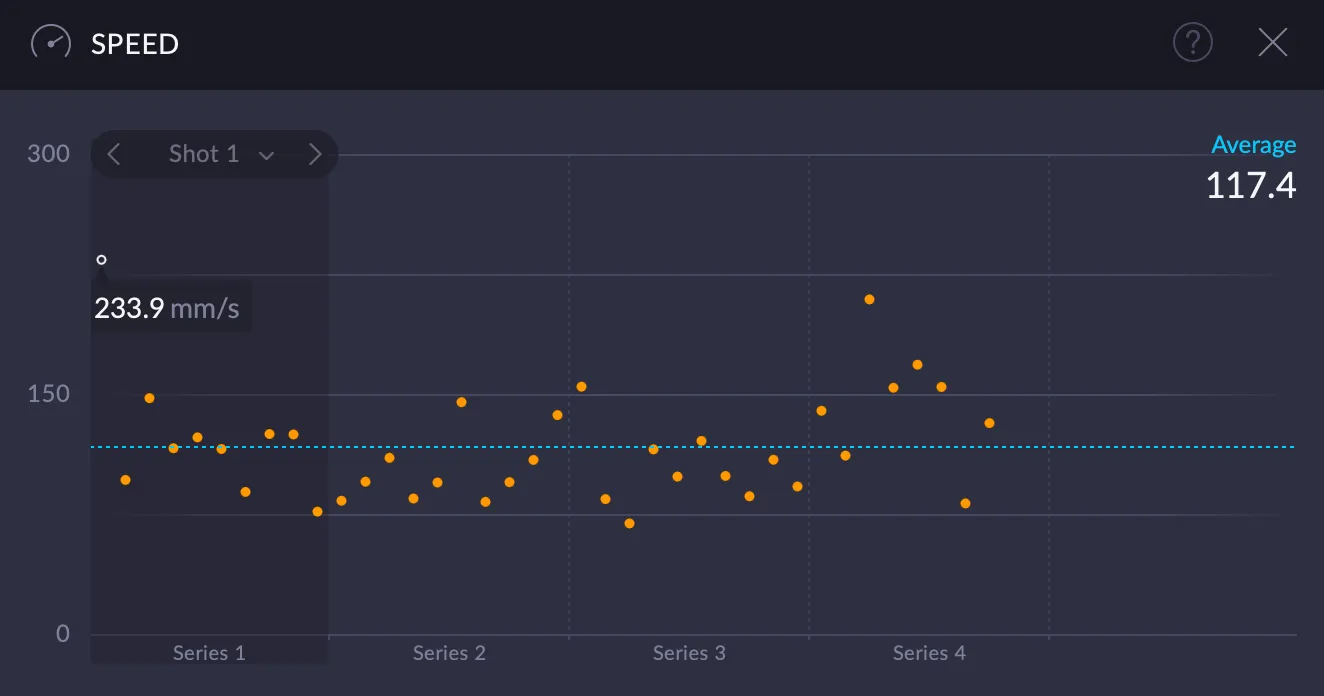
Speed in 1 sec (S1)
Average aimpoint speed before the shot (mm/s).
Practical interpretation (pistol)
- Reflects stance, balance, and physical control
- Worsening S1 late in sessions usually indicates fatigue
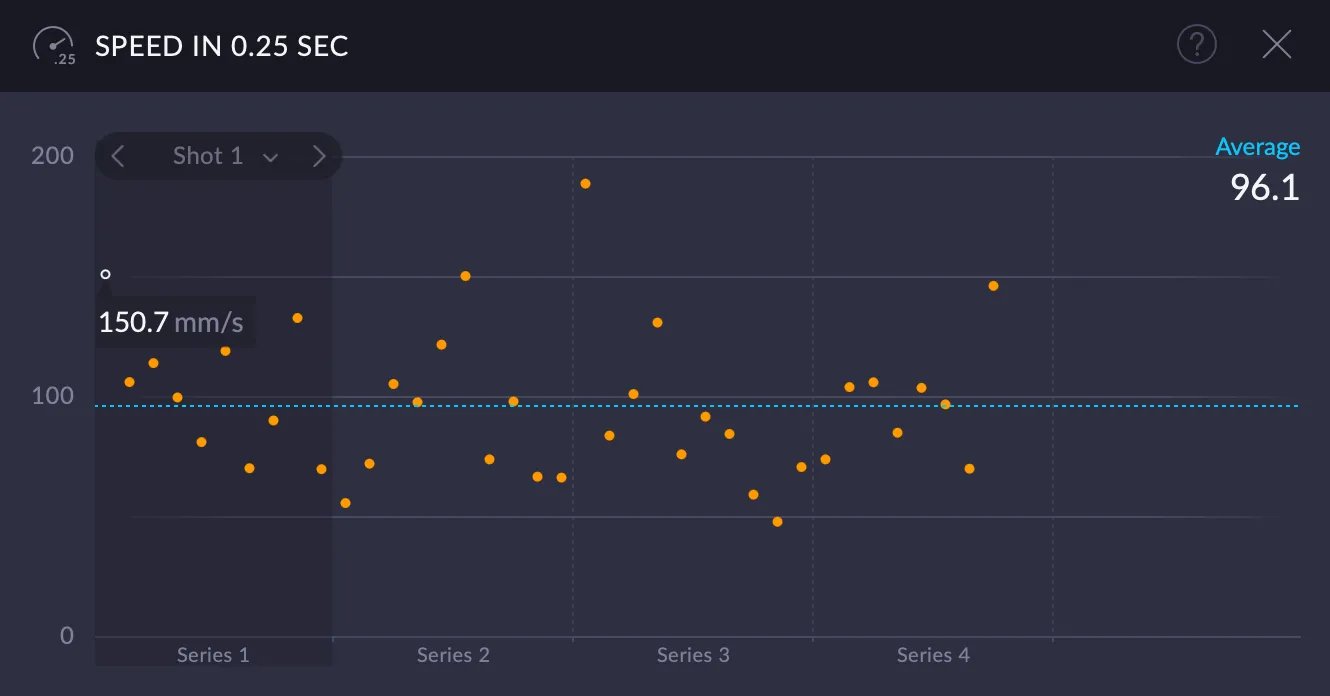
Speed in 0.25 sec (S2)
Average aimpoint speed in the last 0.25 s (mm/s).
Practical interpretation (pistol)
- Trigger influence indicator
- S2 should never be significantly higher than S1
- Spikes correlate strongly with diagonal or low-left shots
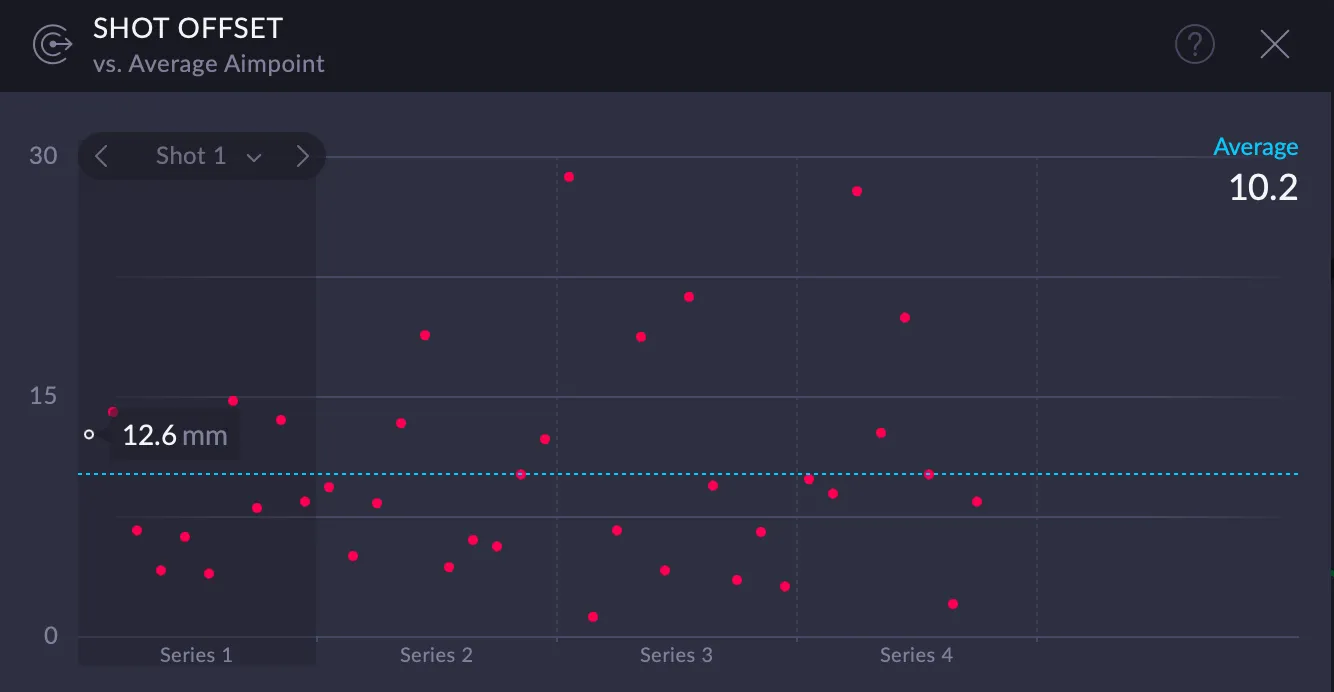
Shot Offset (DA)
vs. Average Aimpoint
Distance between Average Aimpoint and shot hole (mm).
Practical interpretation (pistol)
- Measures timing quality, not centering
- Low DA = clean release
- High DA with good hold = poor decision moment

4. Reset to Default
Tap to reset settings to default
Reference Values (Guidelines, Not Targets)
Typical ranges for precision pistol shooters
| Level | S1 (mm/s) | S2 (mm/s) | DA (mm) |
|---|---|---|---|
| Beginner | 180–300 | 200–350 | 6–10 |
| Club / Regional | 120–180 | 120–200 | 4–6 |
| National | 80–120 | 80–120 | 2.5–4 |
| International elite | 50–80 | 50–80 | 1.5–2.5 |
Relationships matter more than absolute numbers.
Final Takeaway
SCATT is most powerful when used to answer three questions
SCATT data becomes meaningful only when it is used to separate cause from effect. Every shot can be understood by answering the following three questions in order:
How stable was the gun?
→ S1, Hold within Relative Z
This question asks whether the shooter’s posture, grip, and balance provided a stable platform before the trigger was released.
- S1 describes overall movement speed of the aimpoint
- Hold within Relative Z shows how much of the pre-shot time the gun stayed inside the shooter’s real holding area
If these values are poor, nothing that follows matters — the shot was executed on an unstable base. If these values are good, the shooter had enough stability available to execute a high-quality shot.
Did the trigger disturb the shot?
→ S2, DA
This question isolates the trigger action from general movement.
- S2 shows whether movement increased during the final trigger phase
- DA shows how far the shot was released from the average aimpoint
If S2 rises significantly above S1, the trigger added movement. If DA is large despite good hold, the trigger or release timing is suspect.
This step determines whether the error was mechanical (trigger/grip) rather than postural.
Was the decision made at the right moment?
→ DA + Aiming Time
Only after stability and trigger neutrality are confirmed does decision-making become relevant.
- DA indicates when within the movement pattern the shot was released
- Aiming Time shows whether the shooter rushed or waited too long
High DA combined with good hold and neutral S2 means:
the shooter released the shot during movement, but not at the optimal phase of that movement.
This is a timing and confidence issue, not a stability or trigger problem.
The correct analysis order (important)
Always evaluate in this sequence:
- Stability (S1, Relative Z)
- Trigger influence (S2, DA)
- Decision timing (DA, Aiming Time)
- Score (last)
Reversing this order leads to incorrect conclusions and wasted training effort.
Key takeaway
SCATT does not tell you what score you should shoot. It tells you which part of the shot process limited the result.
Used this way, SCATT becomes a diagnostic tool — not a judgment tool — and allows training to focus on the true limiting factor, not the most visible one.
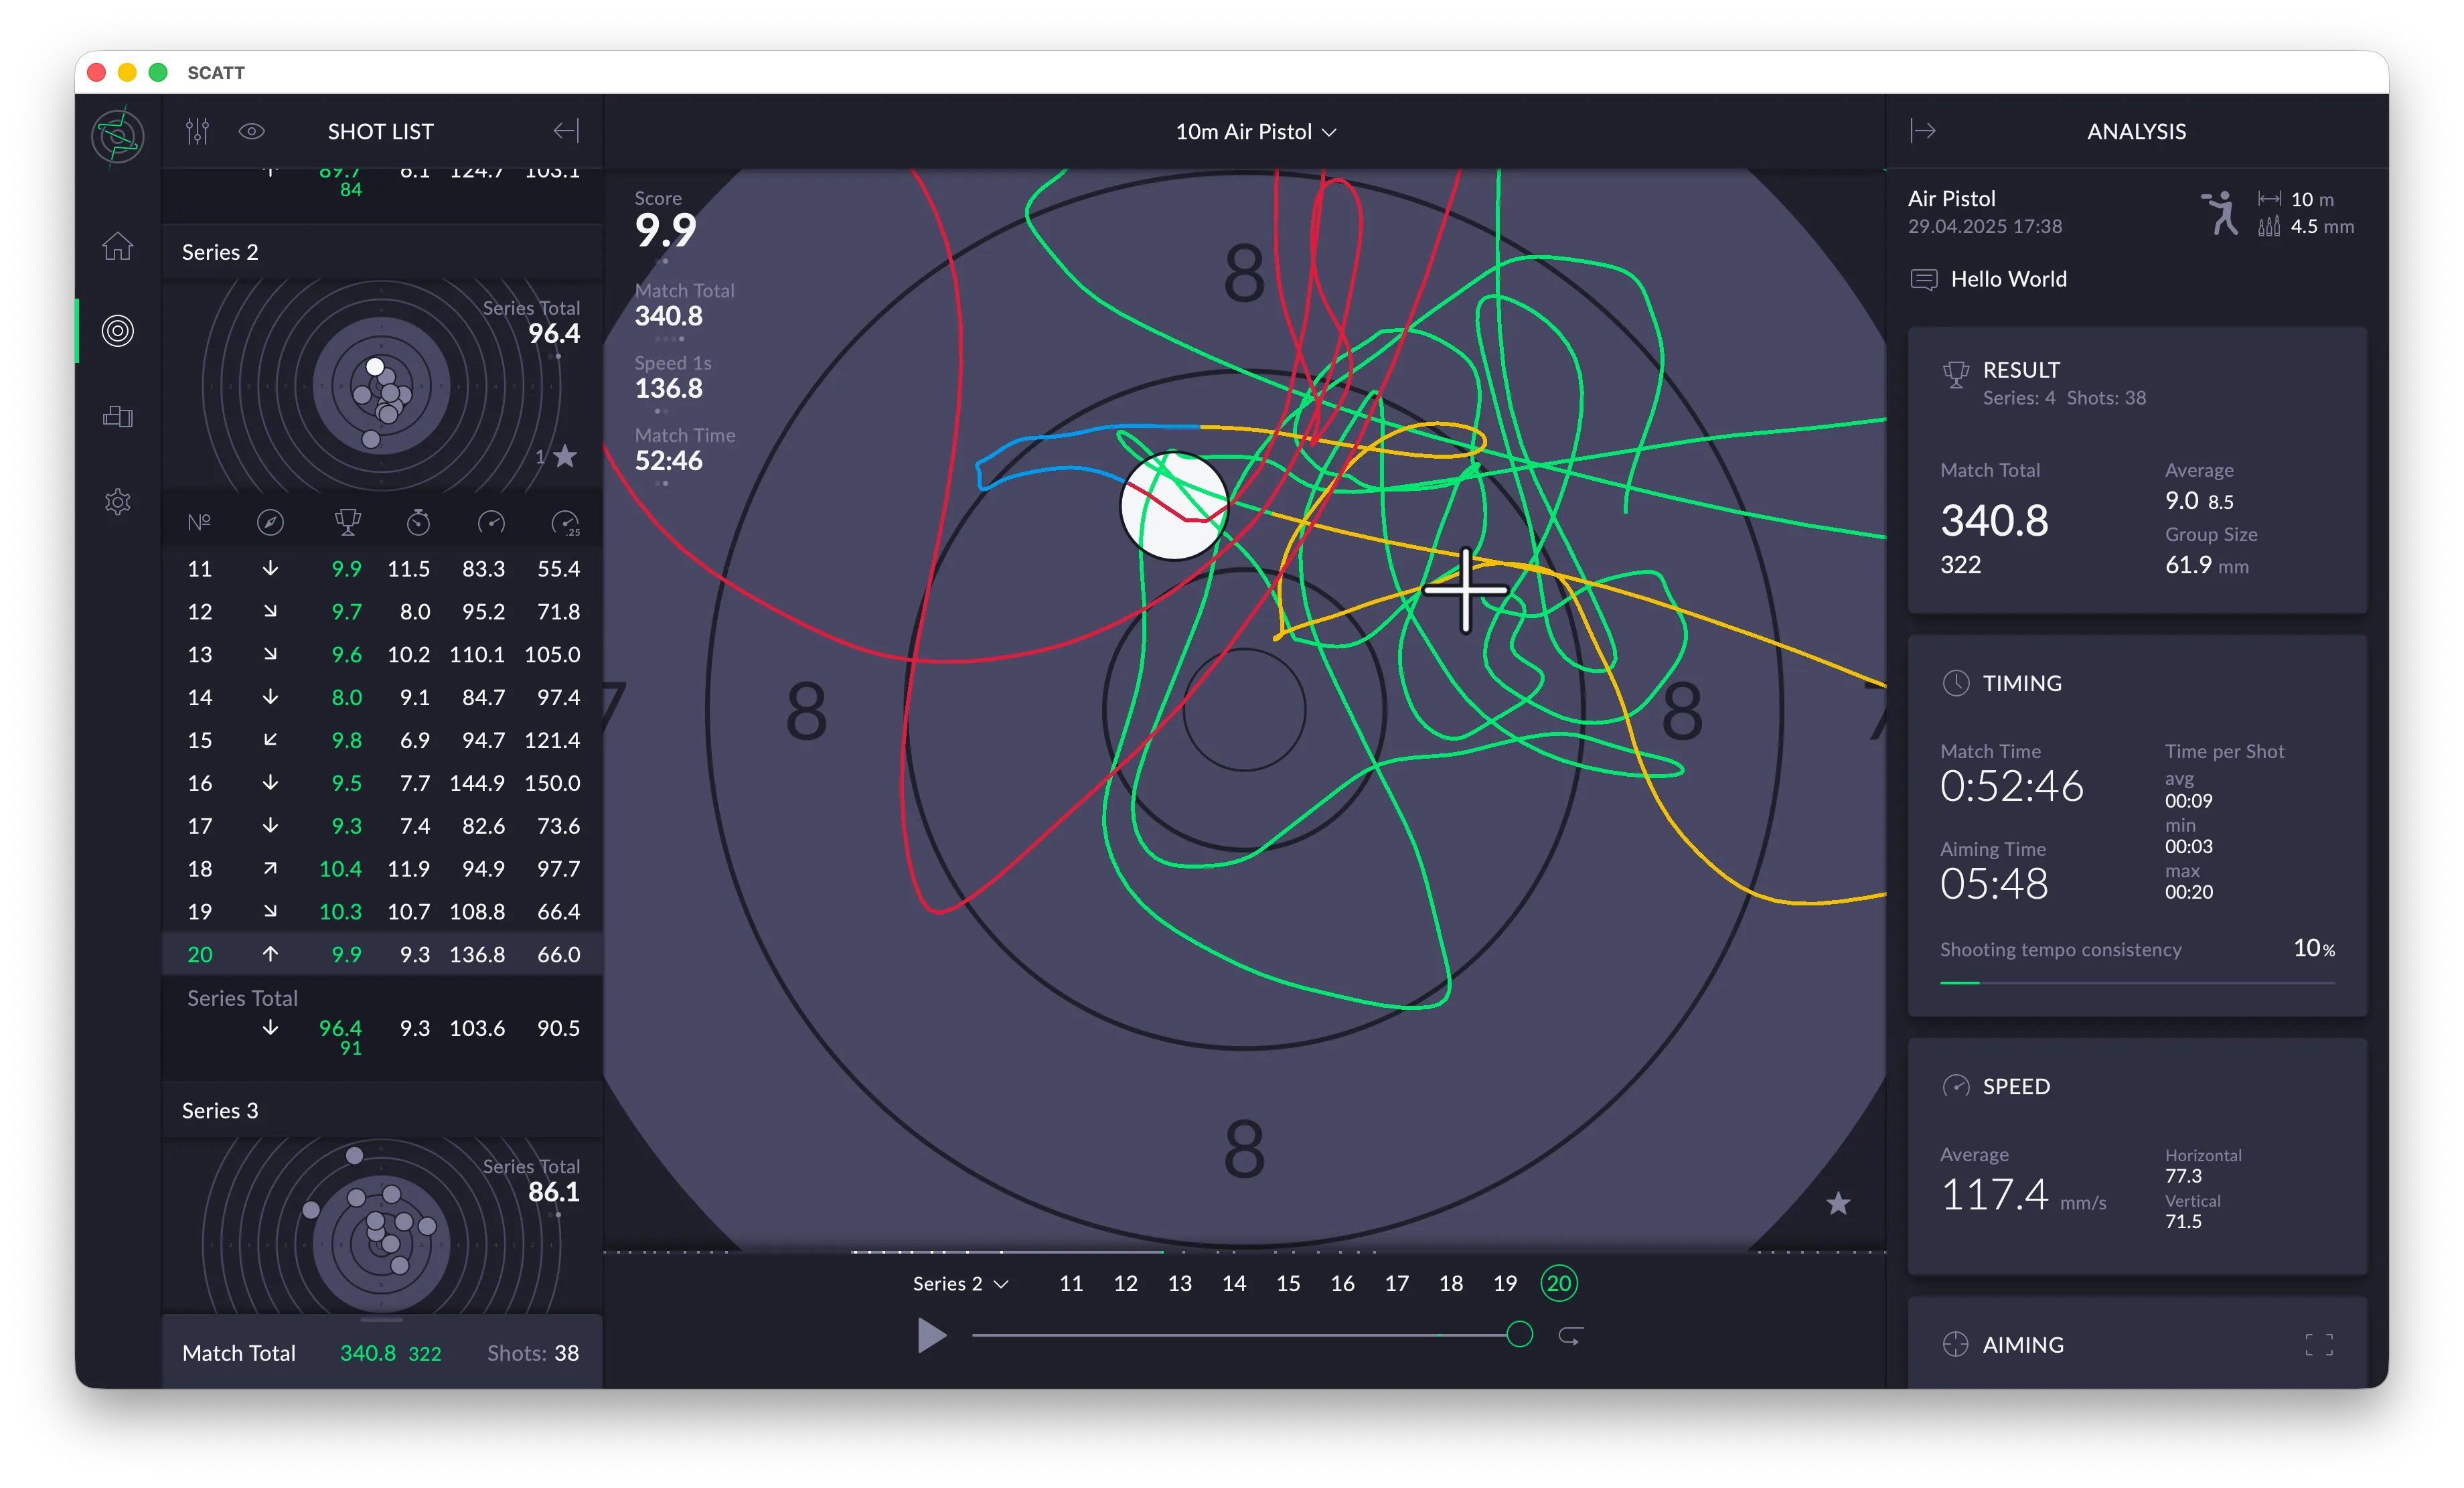
Target
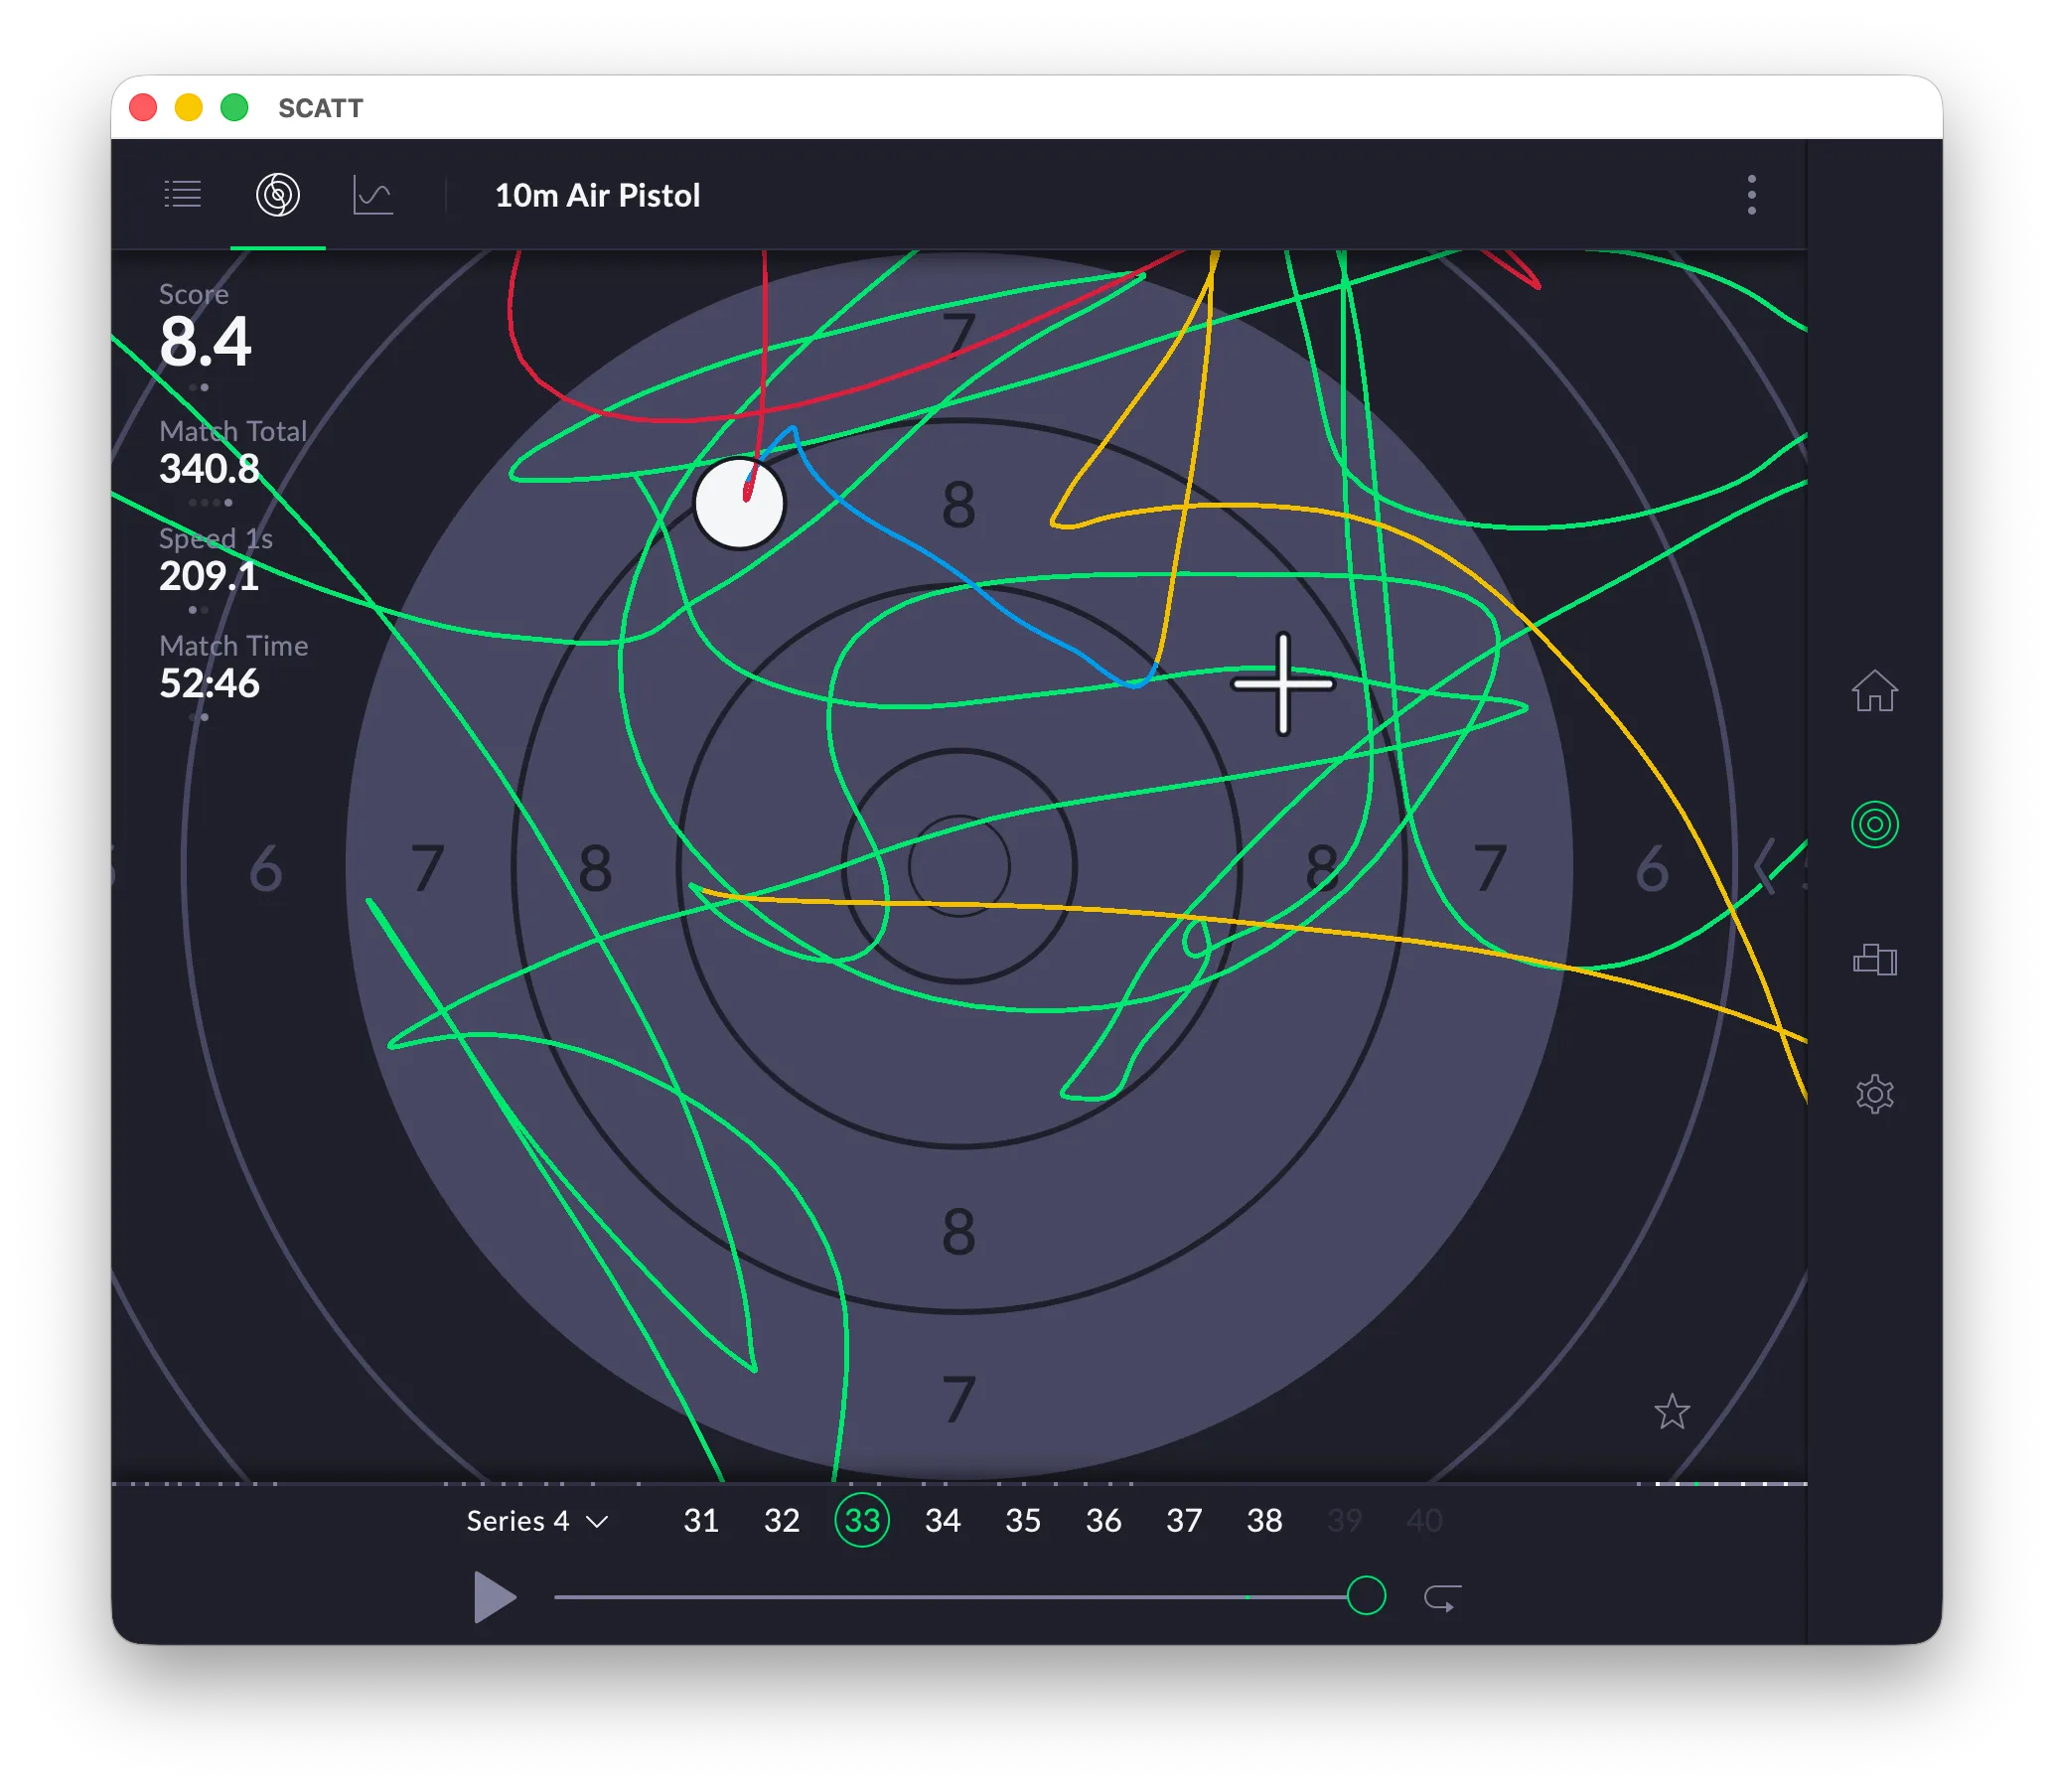
At the center of the screen is a virtual target with scoring rings clearly visible. Overlaid on the target are multiple colored trace lines representing the movement of the shooter’s aim before and during the shot. These lines illustrate how the aiming point traveled across the target area, providing insight into stability, hold pattern, and trigger timing. A white marker indicates the final shot impact.
On the left side of the interface, key performance metrics are displayed, including the shot score, total match score, timing information, and movement-related data. These values give a quick overview of performance for the selected shot.
Along the bottom, a timeline shows shot numbers within the current series, allowing the user to navigate between individual shots. Playback controls are also visible, suggesting that the aim trace can be reviewed dynamically.
Overall, the screen is designed for technical performance analysis. It helps shooters and coaches evaluate aiming behavior, shot execution, and consistency by visualizing movement patterns and providing detailed statistical feedback.
- Green line: the interval from entering the target up to -1 second before the shot
- Yellow line: the interval between -1 and -0.25 seconds before the shot
- Blue line: the interval from -0.25 seconds up to the shot moment
- Red line: interval after the shot
Analysis
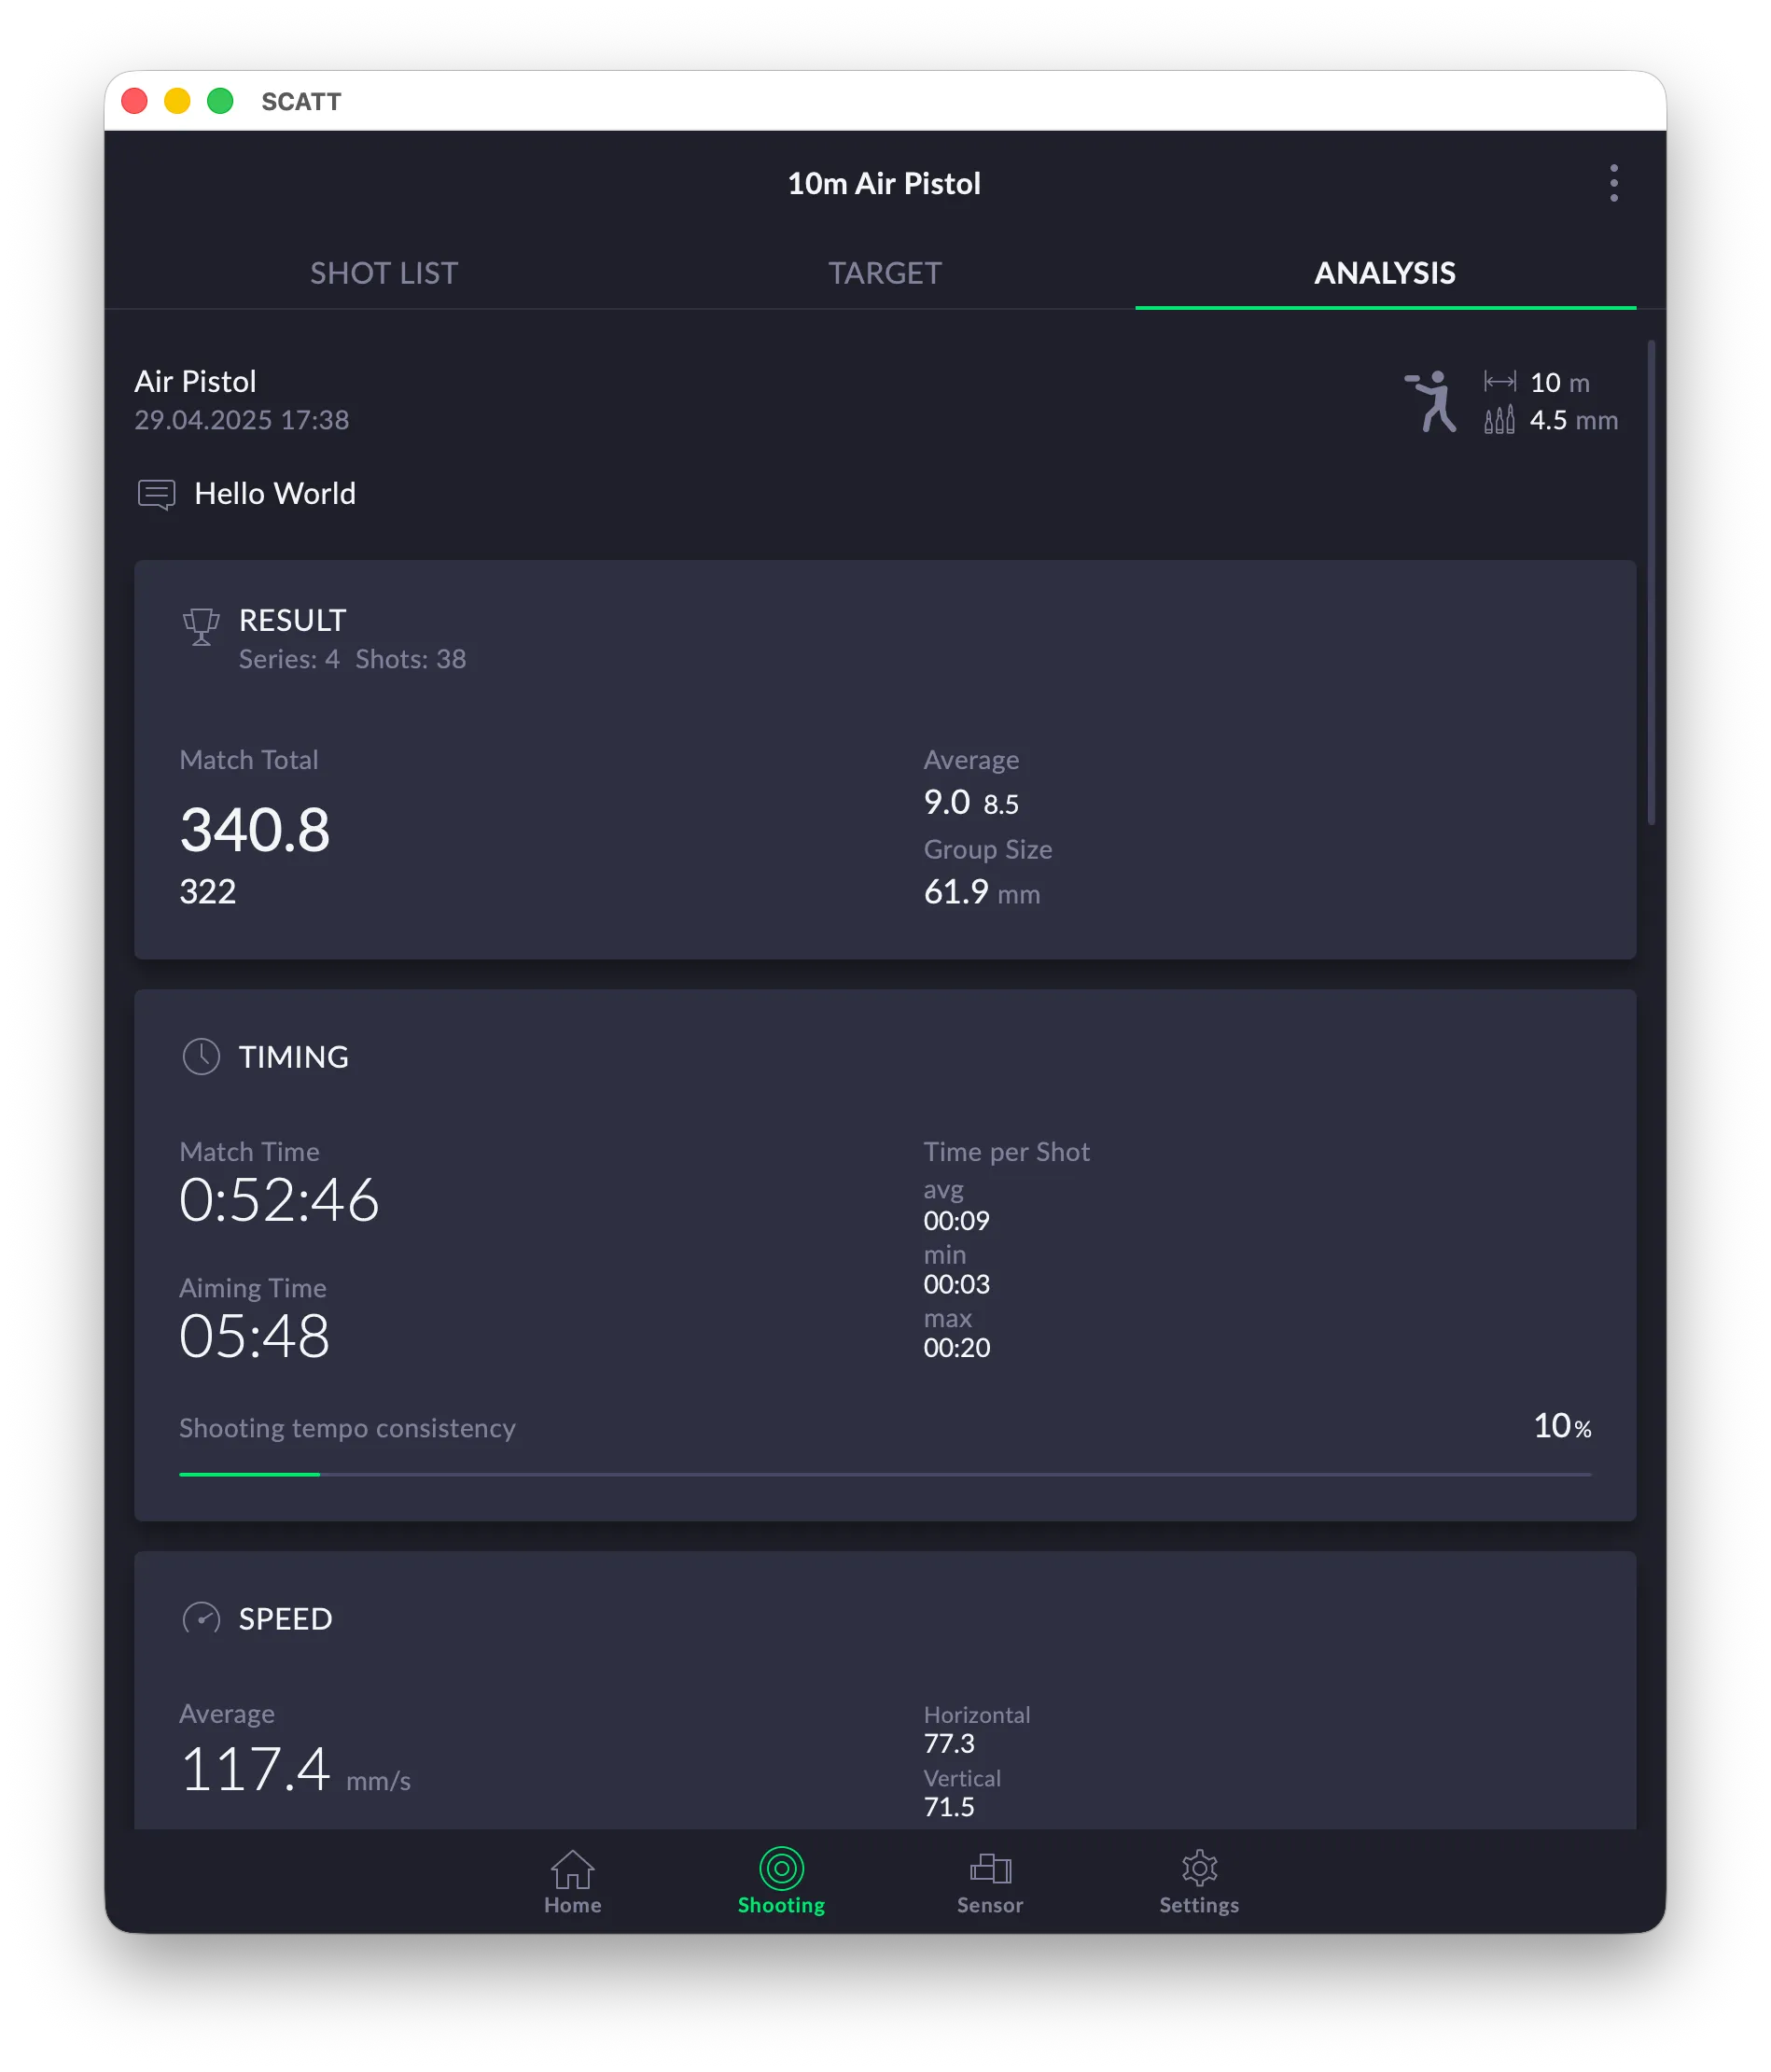
The analysis window shows various graphs to analyze your shooting performance.
General Info
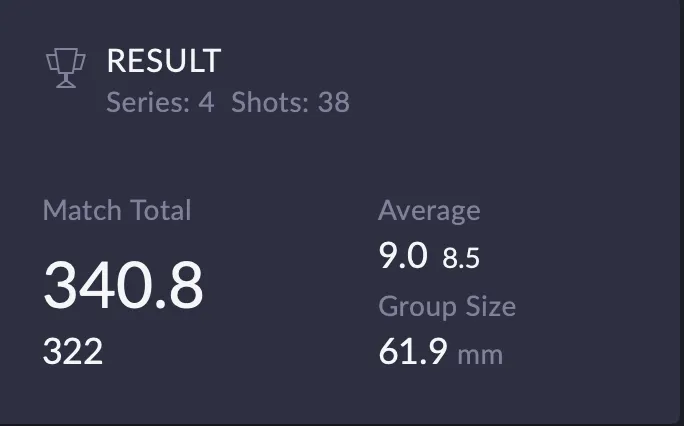
Result
The Result tile aggregates scoring performance across the session, including total score, number of shots, average score (both decimal and integer), and group size. Presenting both decimal and integer averages is especially useful for comparing training performance with match formats. Group size in millimeters provides an objective measure of precision independent of scoring.
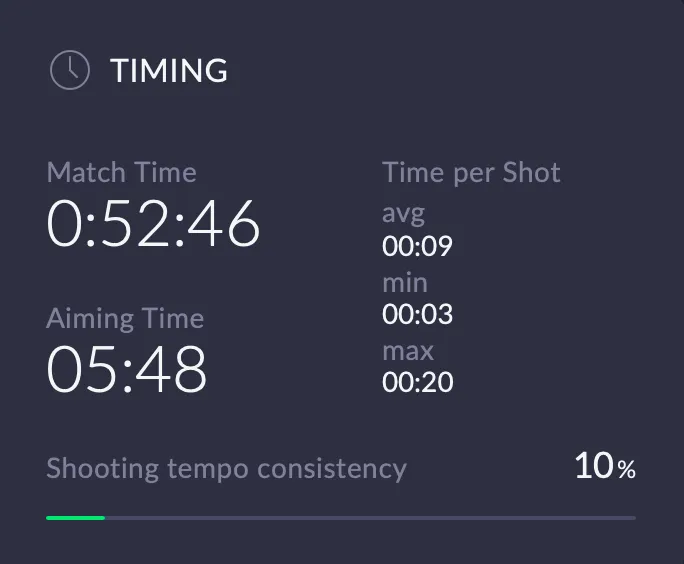
Timing
This panel summarizes the shooter’s time management over the session. It shows total match duration, cumulative aiming time, and average, minimum, and maximum time per shot. Particularly useful is the shooting tempo consistency indicator, which visualizes how evenly the shooter maintains their rhythm across the session. This gives immediate insight into pacing discipline and temporal stability, key factors in precision shooting.
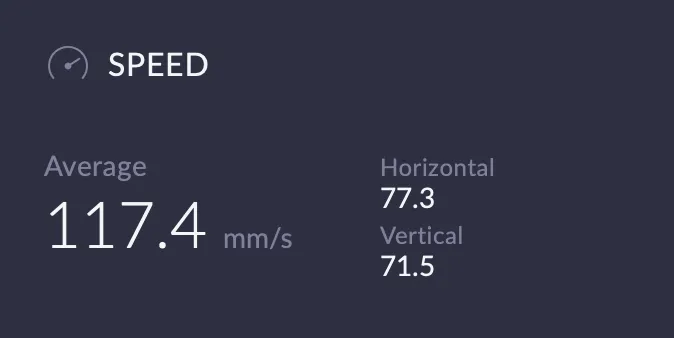
Speed
The Speed overview provides a high-level summary of muzzle movement velocity during aiming. The average speed is shown alongside horizontal and vertical components, allowing a quick assessment of directional dominance. This separation helps distinguish between lateral stability issues and vertical control problems, which often have different technical causes.
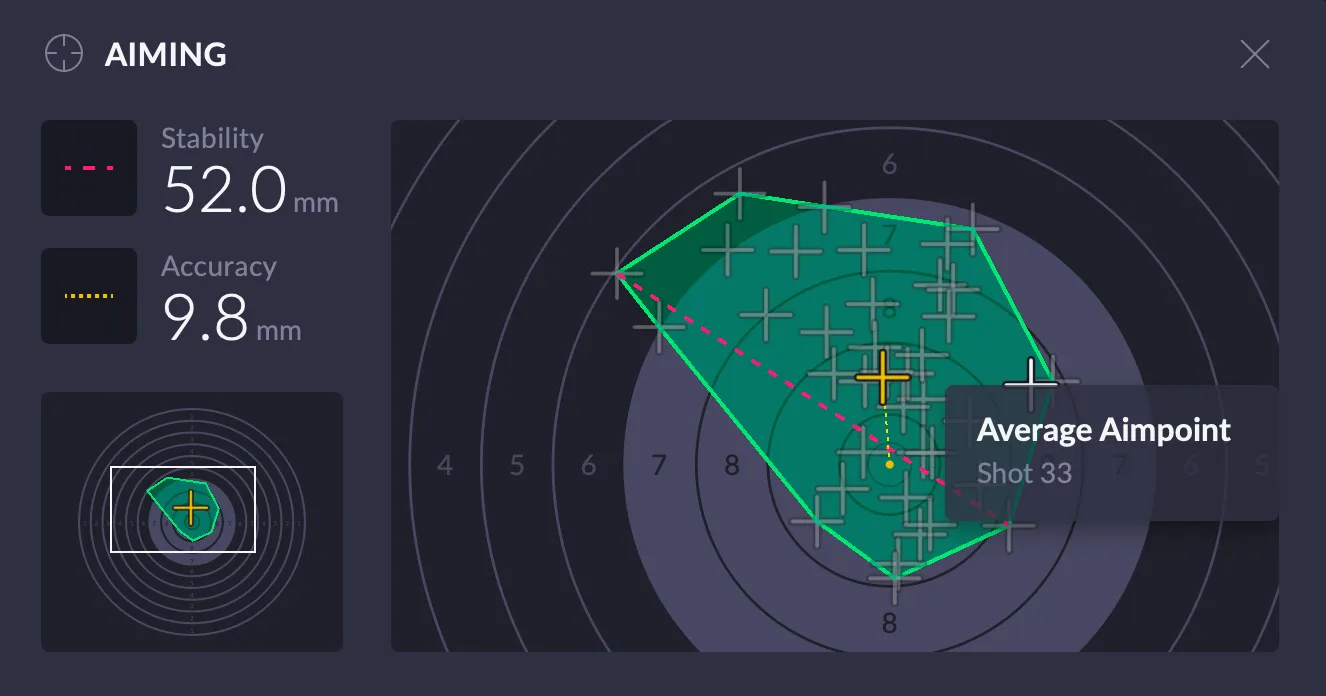
Aiming
The Aiming view combines spatial accuracy and stability into a single visualization. The stability metric quantifies the size of the aiming movement, while accuracy shows the distance between the average aim point and the target center. The plotted aim traces and average aim point give an intuitive understanding of movement patterns, directional bias, and hold symmetry.
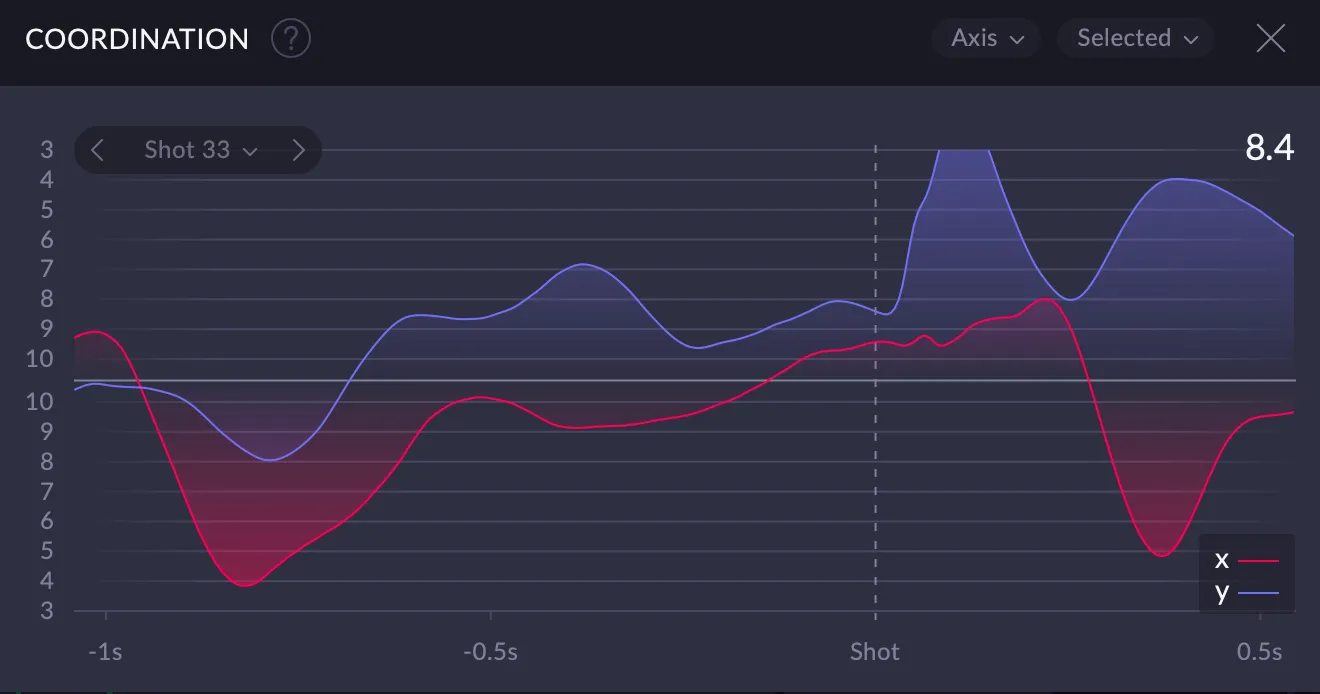
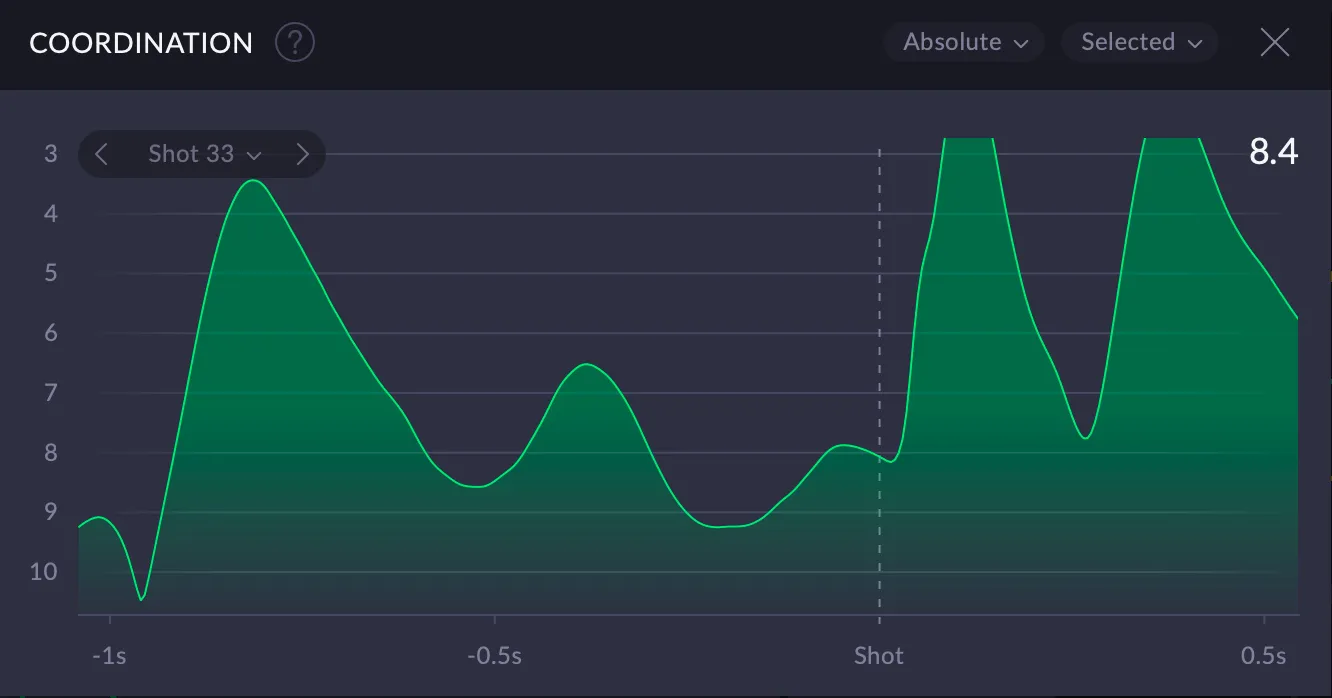
Coordination
SCATT description:
Coordination implies the shooter’s ability to decide on the most optimal moment to pull the trigger set against their aimpoint stability. Coordinate points of the graph represent aimpoint movements within a set timeframe before the shot.
The curve’s behavior (whether it is ascending or descending) 0.25 seconds before the shot is the main gauge when it comes to shooter’s coordination. The more apparent and blatant the change in the curve 0.25 seconds before the shot appears to be, the worse is that shooter’s coordination is (meaning that the control over hold stability gets significantly worse here).
The graph can be displayed based on the X-axis, the Y-axis or in common values for selected shots as well as for all recorded shots in the entire session. Dynamic overlap option is available. This display option puts the selected shots’ graph on top of the aggregate graph for the series.
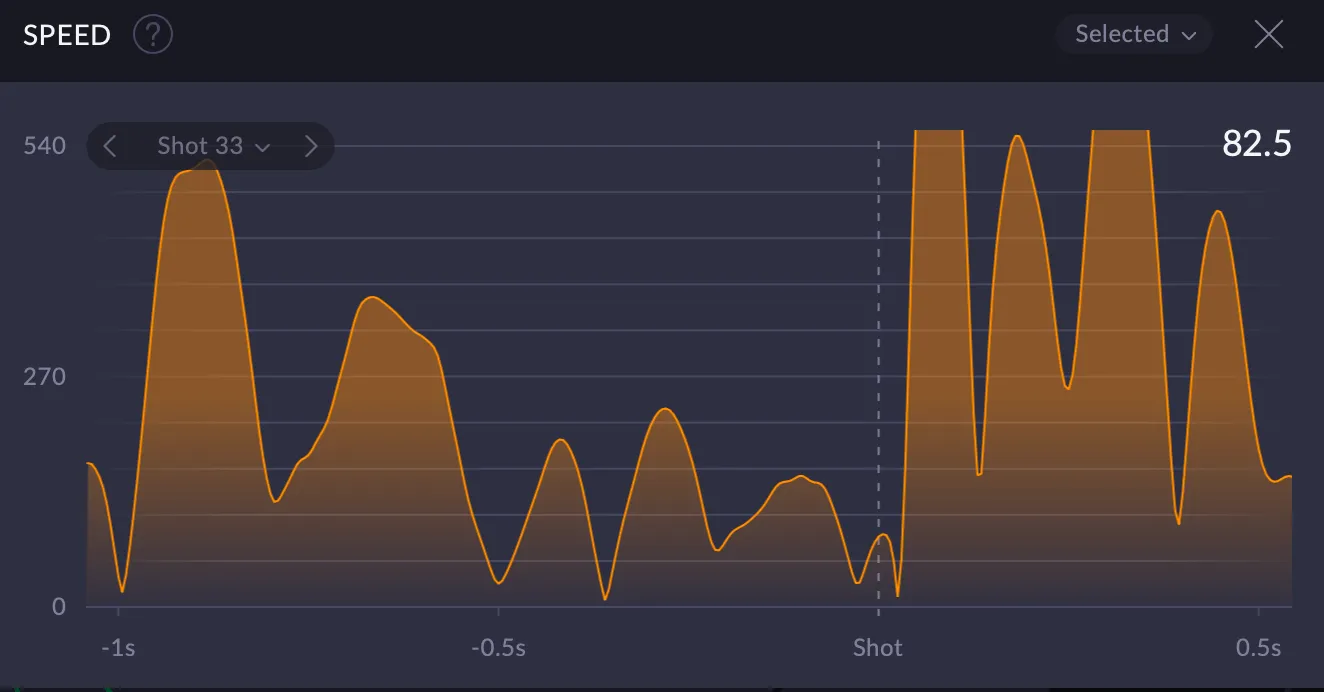
Speed
SCATT description:
The graph shows how aimpoint speed fluctuates within a set timeframe before the shot. We can get a good understanding of shooter’s hold stability based on the overall data and the nature of the curve displayed. The lower the speed readings get, the better is one’s hold stability.
The graph can be displayed for selected shots or for all recorded shots in the entire session. Dynamic overlap option is available. This display option puts the selected shots’ graph on top of the aggregate graph for the series.
Result
SCATT description:
Result graph highlights a hypothetical result that would have been recorded if the shot was taken sometime before the actual trigger pull. Comes in two display options: Integer and With decimals. The graph can be displayed for selected shots or for all recorded shots in the entire session.
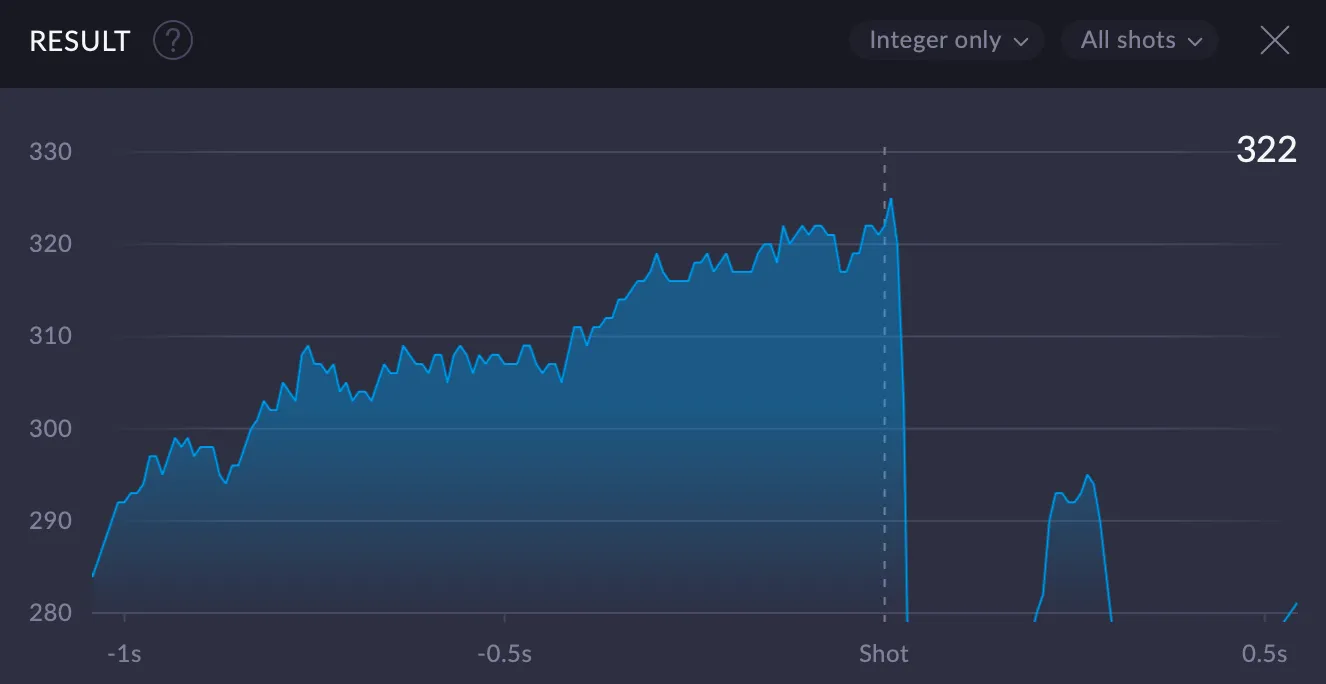
SCATT Expert 20.05.31: Time shift
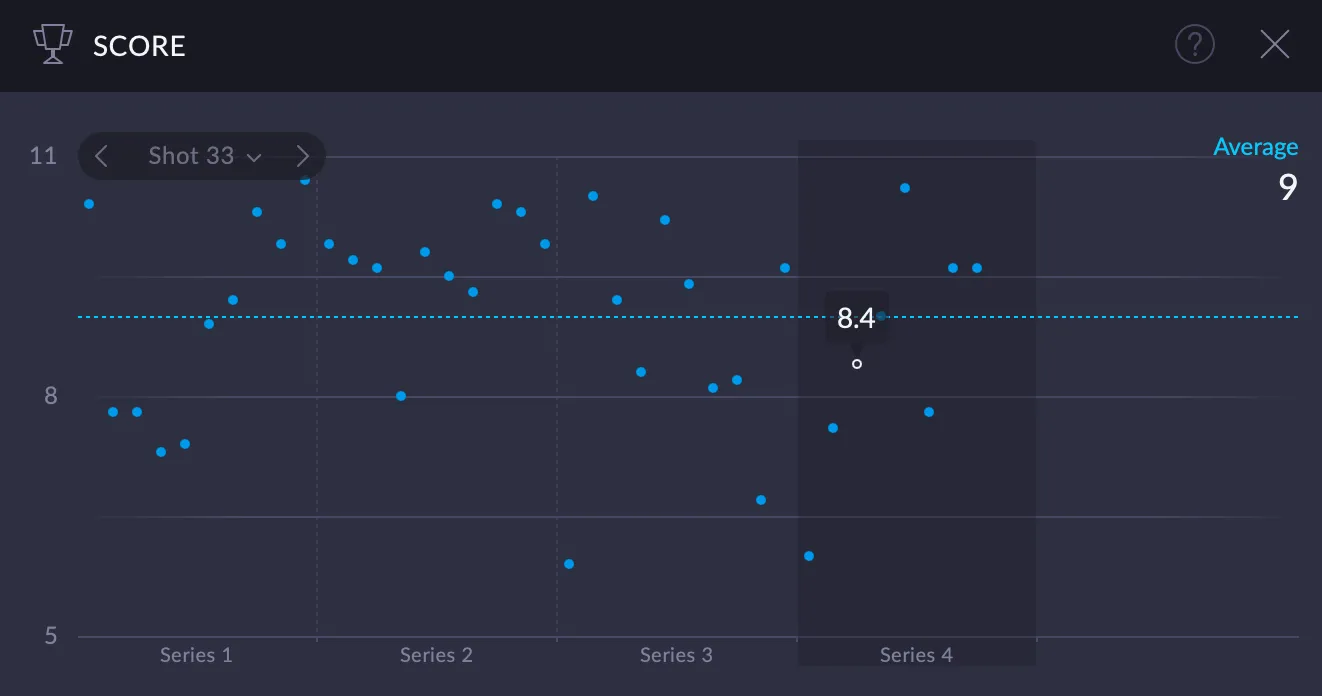
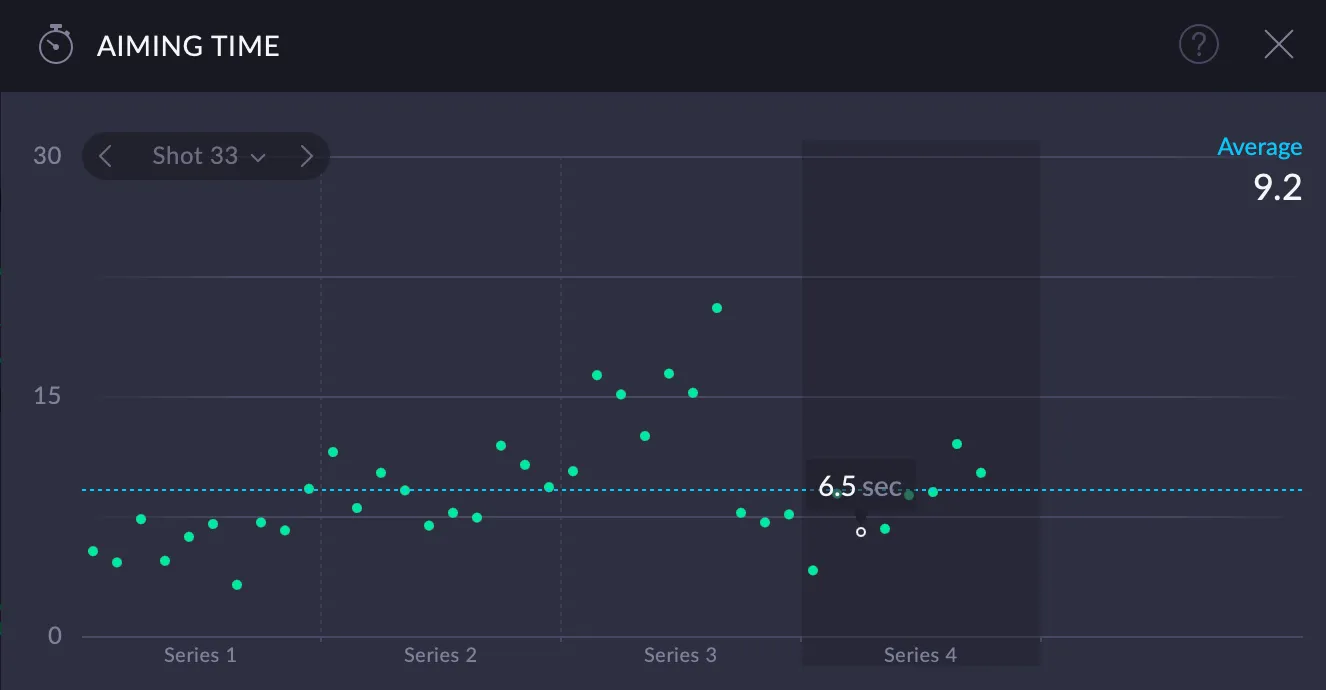
Dynamics
The graph shows how the selected parameter changes over time during the practice
Dynamics was introduced in Scatt Expert for iOS in version 24.10.12. (2024)
Please, welcome Dynamics – the newest addition to the graphs family! Versatility is the name of the game, as you are the one to pick the parameters based on your vision and individual goals.
Score
Aiming time
Hold within 10
Hold within relative 10
Hold within relative 10.5
Speed
Speed in 0.25 sec
Shot offset
Timeframe for Analysis
Data from this part of the trace line is used for analysis. It precedes the shot and consists of the yellow and blue stages.

Conclusion
Scatt Expert 25.12.1 represents a meaningful step forward, not through radical changes to the underlying analysis concepts, but by making those concepts clearer, more accessible, and easier to work with in practice. The redesigned interface improves workflow and readability, while the modular layout allows shooters and coaches to focus on the information that matters most for a given task.
The new analysis views, particularly Coordination and Dynamics, add useful depth when interpreted correctly. They do not replace fundamental technique or structured training, but they offer better tools for identifying patterns, confirming assumptions, and tracking changes over time. When used thoughtfully, the software supports more informed decision-making rather than chasing isolated metrics.
Importantly, Scatt Expert 25.12.1 feels less like a tool designed only for experienced SCATT users and more like a system that guides analysis step by step. The cleaner UI, responsive layout, and consistent design across platforms reduce friction and cognitive load, allowing attention to remain where it belongs: on shooting performance.
As with any optoelectronic training system, the value of Scatt Expert 25.12.1 depends on how the data is interpreted and applied. Used as part of a structured training process, it remains a powerful aid for understanding execution, consistency, and timing — not just scores.